
Myeloma is a blood cancerA term for diseases in which malignant cells divide without control. Cancer cells can invade nearby tissues and spread through the bloodstream and lymphatic system to other parts of the body.
Myeloma is the 2nd most common form of blood cancer, yet sadly most people have never heard of it. Myeloma is associated with the abnormal behaviour and uncontrolled growth of a type of white blood cell—the plasmaThe liquid part of the blood in which red blood cells, white blood cells, and platelets are suspended. cellThe basic unit of any living organism.. Plasma cellsSpecial white blood cells that produce antibodies. The malignant cell in myeloma. Normal plasma cells produce antibodies to fight infection. In myeloma, malignant plasma cells produce large amounts of abnormal antibodies that lack the capability to fight infection. The abnormal antibodies are the monoclonal protein, or M protein. Plasma cells also produce other chemicals that can cause organ and tissue damage (i.e. anemia, kidney damage and nerve damage). are made in the bone marrow—the spongy tissue found inside bones—and when they’re healthy, they are an important part of your body’s immune systemThe complex group of organs and cells that produces antibodies to defend the body against foreign substances such as bacteria, viruses, toxins, and cancers. because they help fight infection by producing antibodies that attack germs.
In myeloma, the plasma cells become cancerous (myeloma cells) and interfere with the production of healthy blood cellsMinute structures produced in the bone marrow; they include red blood cells, white blood cells, and platelets. in the bone marrowSpongy tissue that is found inside your bones. It is soft, fatty and full of blood vessels. Your bone marrow is where most of the blood cells in your body are made.. Instead of producing antibodies that fight infection and disease, myeloma cells produce abnormal proteins (called monoclonalA clone or duplicate of a single cell. Myeloma develops from a single malignant plasma cell (monoclone). The type of myeloma protein produced is also monoclonal; a single form rather than many forms (polyclonal). The important practical aspect of a monoclonal protein is that it shows up as a sharp spike (M spike) in the serum electrophoresis test. protein, monoclonal immunoglobulin, or M-protein). These can cause serious complications and affect different parts of the body such as the bones and kidneys. Although myeloma is a blood cancer, sometimes myeloma cells collect and form a plasmacytomaA collection of plasma cells found in a single location rather than diffusely throughout the bone marrow, soft tissue, or bone. (a tumour made of plasma cells).
The cause or causes of myeloma remain relatively unknown but there is increasing research that suggests possible associations between myeloma and a decline in immune function, geneticInherited; having to do with information that is passed from parents to children through DNA in the genes. factors, and the environment.
The number of Canadians diagnosed with myeloma is steadily increasing year after year. While there is not yet a cure, people with myeloma are living longer and better lives thanks to recent breakthroughs in research and treatment.

What causes myeloma?
Learn more about the causes and precursors of myeloma, including Monoclonal Gammopathy of Undetermined Significance (MGUS) and Smouldering Multiple Myeloma (SMM).

Myeloma vs. melanoma
Myeloma is often confused with melanomaA cancer of the pigment-forming cells of the skin or the retina of the eye. Not associated with myeloma despite the similar-sounding name.. Myeloma, also sometimes called “multiple myeloma,” is a cancer of the plasma cells, a type of immune cell, in the bone marrow. Melanoma refers to a form of cancer that usually occurs in the skin, but can also occur in the eye and mucous membranes.
Where “multiple myeloma” gets its name
Myeloma cells multiply in the bone marrow and interfere with the production of good, healthy red blood cells, white blood cells, and platelets. As a result, myeloma can affect several places in the body where bone marrow is normally active in adults (like the bones of the spine, skull, pelvis, and rib cage, as well as the long bones in arms and legs and areas around the shoulders and hips), which is why it’s often referred to as multiple myeloma.
Types of myeloma
Myeloma is not really just one disease. It’s a disease with several subtypes.
Instead of producing a variety of healthy antibodies (known as immunoglobulins) that can fight infection, myeloma cells (abnormal plasma cells) produce non-functional clones of one type of antibody commonly referred to as monoclonal antibodiesArtificially manufactured antibodies specifically designed to find and bind to cancer cells for diagnostic or treatment purposes. They can be used alone, or they can be used to deliver drugs, toxins, or radioactive material directly to tumor cells., M-protein, monoclonal protein, paraprotein, myeloma protein, or M-spike.
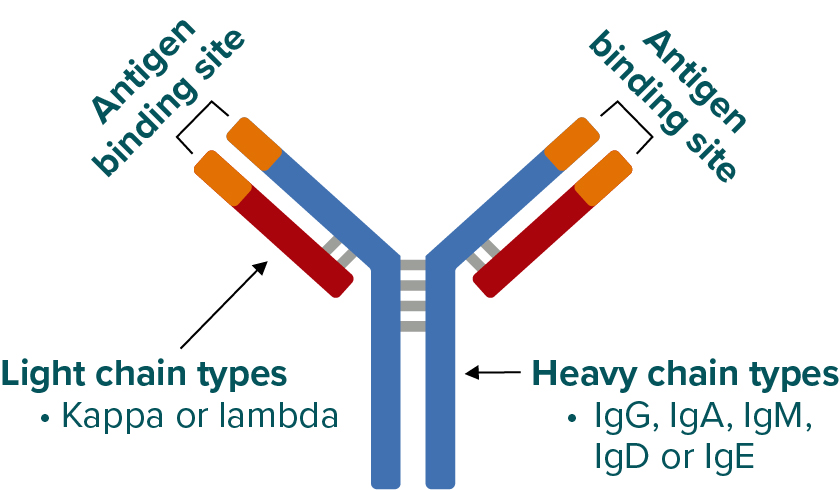
Immunoglobulins are made up of 2 heavy chain proteins and 2 light chain proteins bound together.
There are:
- five (5) types of heavy chains: G, A, M, D, or E
- two (2) types of light chains: kappa (κ) or lambda (λ)
Structure of an antibody (immunoglobulin)
The specific type of myeloma a person has is based
on the immunoglobulin (abbreviated as “Ig”) that is overproduced by the myeloma cells (eg, in IgG
lambda myeloma, myeloma cells overproduce an immunoglobulin made from 2 IgG heavy chains
bound to 2 lambda light chains.)
The 10 possible myeloma subtypes are:
- IgG lambda
- IgA lambda
- IgMUsually associated with Waldenstrom's macroglobulemia. In rare cases can be a type of myeloma. lambda
- IgD lambda
- IgE lambda
- IgG kappa
- IgA kappa
- IgM kappa
- IgD kappa
- IgE kappa
About 60–65% of all cases of myeloma involve the overproduction of immunoglobulins made with “G” heavy
chains (IgG).
Some people (approximately 15–20%) with myeloma have light chain myeloma (also known as Bence-Jones myeloma) that secretes only light chains and no heavy chains in the urine.
An even smaller proportion of people (1–5%) with myeloma have non–secretory myeloma that secretes very little or no monoclonal protein.
IgM myeloma is very rare and typically occurs in Waldenstrom’s macroglobulinemia.
The relapsing-remitting nature of myeloma
Myeloma is a relapsing-remitting cancer. This means that it alternates between periods of heightened activity where symptoms and/or complications are active and need to be treated, and stable diseaseThis describes patients who have some response to treatment but <50% reduction in myeloma protein levels. Stable disease is not necessarily bad or sub-optimal (as compared to CR or PR) provided the myeloma has stabilized and is not progressing. With slow moving myeloma, stabilization can last for many years. (remission) that’s often controlled by treatment, but not always.
A relapseThe reappearance of signs and symptoms of a disease after a period of improvement. is when myeloma returns or becomes active again after a period of remission or treatment.
It’s also important to know that it isn’t always necessary to treat myeloma right away. If the myeloma isn’t active or causing signs or symptoms, sometimes the chosen course of action is to wait and closely monitor the disease.

Symptomatic or active myeloma
Symptomatic (active) myeloma requires treatment.
Symptoms associated with the overproduction of myeloma cells and monoclonal protein are commonly evaluated using the “CRAB” criteria:
HyperCalcemia – elevated calciumMineral found mainly in the hard part of bone. in the blood
Renal insufficiency – kidney damage
Anemia – low levels of hemoglobin in red blood cells (RBCs)
Lytic Bone lesions – pain in the bones and/or fractures
Other general symptoms include frequent or recurring infections and fatigue/weakness.
You may also hear the term “SLiM” (as defined by the International Myeloma Working Group) in relation to diagnosing myeloma. SLiM refers to a newer, more in-depth diagnostic set of criteria that better identifies people requiring active myeloma treatment even if they are not experiencing CRAB symptoms.
SLiM criteria include the following 3 Myeloma Defining Events (MDEs):

Sixty percent (60%) or more myeloma cells in the bone marrow, and/or

Light chains: Involved/uninvolved serum free light chain (sFLC) ratio of 100 or greater (the ratio of kappa-to-lambda or of lambda-to-kappa, depending on which light chain is present in larger quantities), and/or

Magnetic resonance imaging (MRI): More than 1 bone lesionAn area of abnormal tissue change. A lump or abscess that may be caused by injury or disease, such as cancer. In myeloma, "lesion" can refer to a plasmacytoma or a hole in the bone. measuring at least 5 mm in size.

For more information, download the Multiple Myeloma Patient Handbook
Designed to provide educational support to those living with myeloma, their caregivers, families, and friends, this handbook gives accurate, reliable, and clear information on myeloma. Among topics are in-depth discussions on what myeloma is, its causes and effects, treatment options in Canada, and how to manage your myeloma journey.
Coping with your diagnosisThe process of identifying a disease by its signs and symptoms.
A myeloma diagnosis comes with its own unique set of emotional hurdles and no one understands this better than another person living with myeloma.
“Do you recall the day you heard the words ‘You have myeloma?’ I vividly recall that day in 2002 when I was told that I had an incurable disease I had never heard of and that I had three to five years to live. I remember being overwhelmed by feelings of fear, panic, dread, terror but above all a feeling of aloneness.”
—Aldo Del Col
Co-Founder, Myeloma Canada

There is no “right” or “wrong” way to react
Whatever you’re feeling is natural and completely understandable. You’ve been given a lot to process and to come to terms with. The diagnosis affects everyone differently.
Hear from other people living with myeloma
A myeloma diagnosis can feel overwhelming, but you are not alone. The apprehensions you may be experiencing are a normal part of coming to terms with your diagnosis. Watch the videos below to hear from other patients and learn about available resources.

You are not alone
Myeloma touches the lives of tens of thousands of Canadians. Whether you’re living with this disease or caring for someone who is, there are community-based support groups across Canada with people who understand the journey you’re on.
In addition to our network of local support groups, there are online (virtual) Facebook support groups and peer-to-peer support programs, so you never feel alone in your journey.
For more information, download the Multiple Myeloma Patient Handbook
Designed to provide educational support to those living with myeloma, their caregivers, families, and friends, this handbook gives accurate, reliable, and clear information on myeloma. Among topics are in-depth discussions on what myeloma is, its causes and effects, treatment options in Canada, and how to manage your myeloma journey.